If you want to know how the something, say the probability of a failure, varies with respect to another continuous variable, like time, don’t cut the variable into several little buckets and calculate the mean in each bucket. You’ll end up with a discontinuous function. And because the probs will depend on how you make the buckets, you’ll start to worry about the best way to make the buckets, a very bias-variance trade-off type problem.
Pictures are useful here:
Don’t do this:
library(dplyr)
library(ggplot2)
library(magrittr)
theme_set(theme_bw(base_size = 20))

dat <- mtcars
dat$buckets <- cut(dat$disp, breaks = 5)

dat %>% group_by(buckets) %>% summarize(m = mean(mpg), se = sd(mpg) / sqrt(n())) %>%
  ggplot(aes(x = buckets, y = m)) +
  geom_point(size = 2) +
  geom_errorbar(aes(ymin = m - 2 * se, ymax = m + 2 * se), width = 0.1)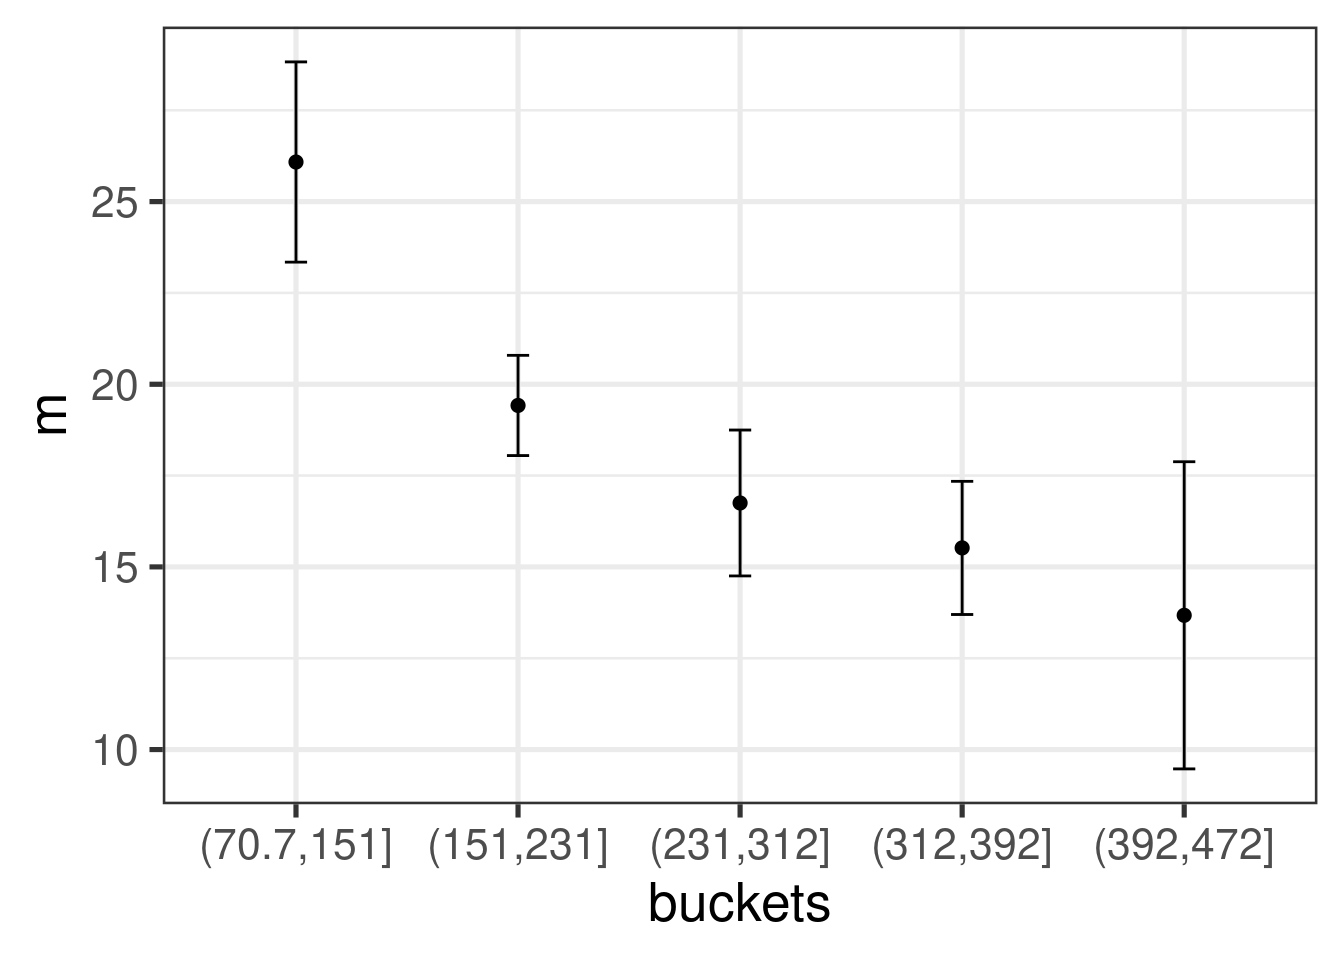
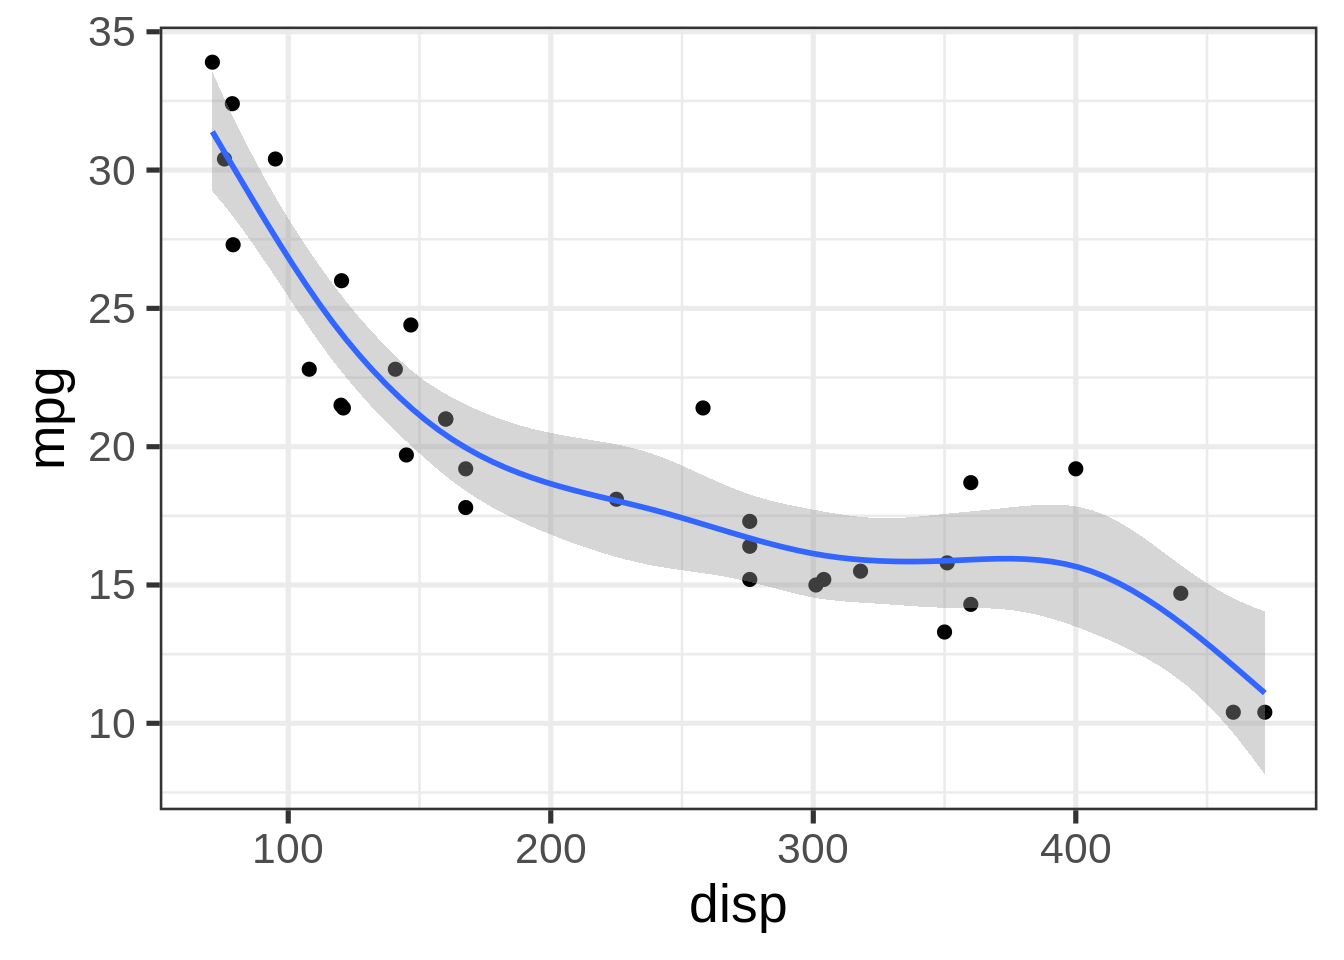
Do (something like) THIS:
dat %>%
  ggplot(aes(x = disp, y = mpg)) +
  geom_point(size = 2) +
  geom_smooth(method = "gam")
## `geom_smooth()` using formula 'y ~ s(x, bs = "cs")'