
When the number of dimensions is big, everything is far away.
Let’s start with two dimensions. Just standard normal distribution.
library(mvtnorm)
set.seed(15)

dat <- rmvnorm(1000, sigma = diag(2))
We can calculate the distance from the points to the origin:
inter <- dat ^ 2
d <- sqrt(apply(inter, 1, sum))
How far away are the points from the origin?
library(ggplot2); theme_set(theme_bw(base_size = 15))

ggplot(data.frame(d = d), aes(x = d)) +
  ggtitle("Distribution of Distances", "N(0, diag(2))") +
  geom_histogram(col = "black", fill = 'royalblue2')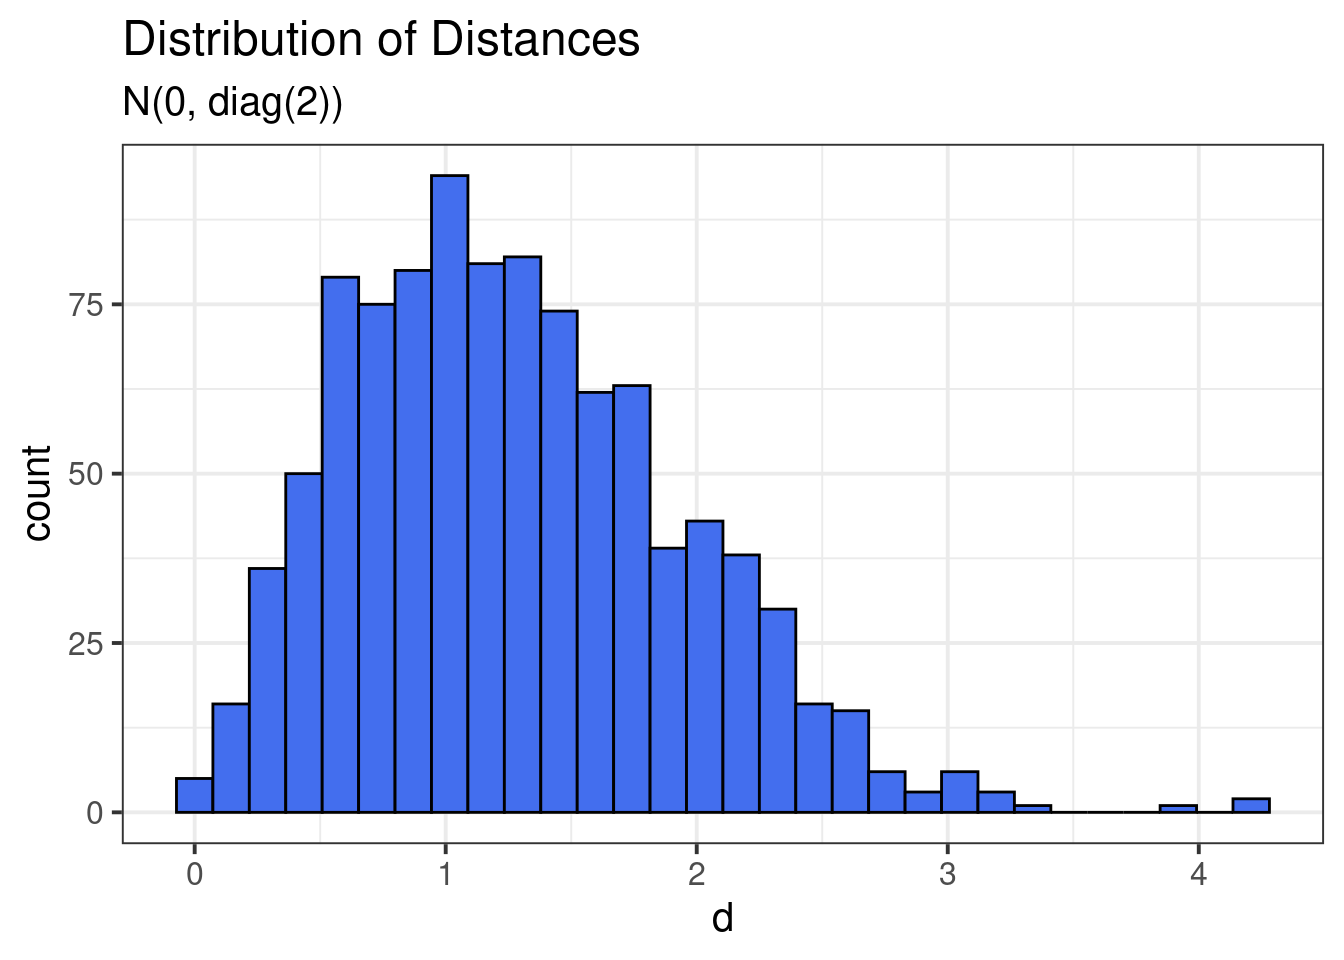
Lots of data are close to 0. In fact, the distances follow a Chi distribution.
What if the dimension gets big? Say 200 dimensional data?
dat2 <- rmvnorm(1000, sigma = diag(200))

inter2 <- dat2 ^ 2
d2 <- sqrt(apply(inter2, 1, sum))

ggplot(data.frame(d2 = d2), aes(x = d2)) +
  xlim(c(0, max(d2))) +
  ggtitle("Distribution of Distances", "N(0, diag(200))") +
  geom_histogram(col = "black", fill = 'royalblue2', bins = 60)
## Warning: Removed 2 rows containing missing values (geom_bar).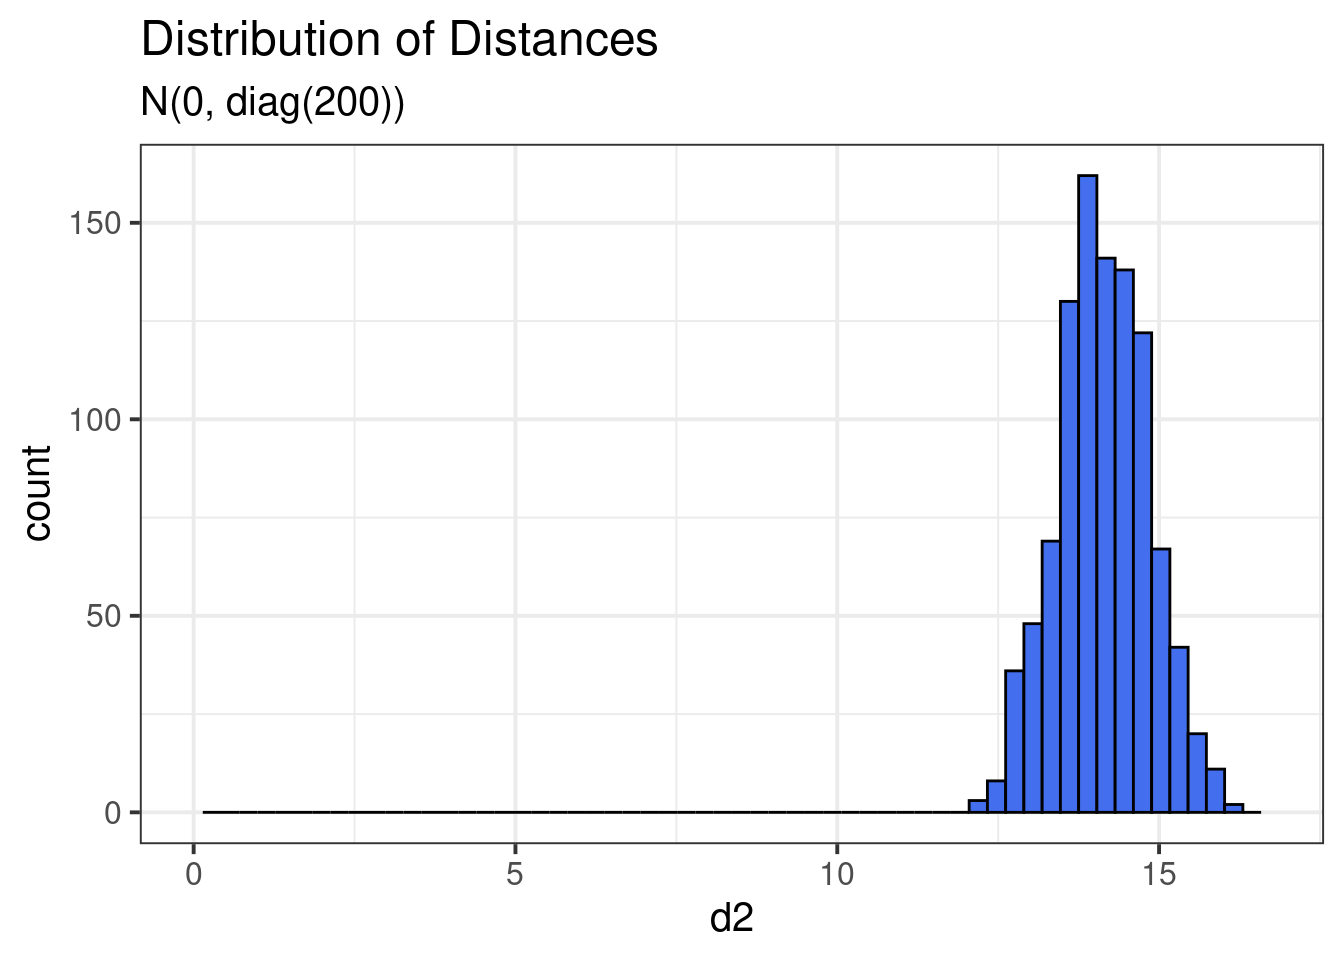
The distances look more normal now, but more importantly, everything is far away from 0 (and everything is far from everything else). In some sense, all the data are concentrating on the ‘shell’ of space. The notion of distance becomes less useful when the data are big.
Big data are weird.